




FintechZoom Gold Price page pulls its live chart from a TradingView widget, not a proprietary data feed, which means the number you see is only as fresh and accurate as TradingView’s underlying source at that moment. Before making any buying or selling decision, cross-check that figure against a primary benchmark like the LBMA Gold Price or a live COMEX futures quote. A few seconds of verification can save you from acting on a stale or delayed number.
What the FintechZoom.com Gold Price Page Actually Shows
Visit the page and you’ll find a live TradingView chart embedded near the top, followed by long-form background reading on gold as an asset. The chart itself updates in near real time because TradingView’s feed does, but the surrounding article content is far less current. As of this writing, gold trades above $4,400 an ounce, yet the page’s written text still references a price near $1,625, a figure last accurate around 2020.
That gap matters. A reader skimming the page for a quick number could easily anchor on the outdated text instead of the live chart above it, especially on mobile where the chart loads slower than the copy.
Where FintechZoom’s Data Actually Comes From
FintechZoom.com does not run its own price feed for gold. It licenses the TradingView widget, the same embeddable chart tool thousands of finance blogs use. TradingView itself sources spot and futures data from exchange partners and liquidity providers, so the accuracy ceiling on FintechZoom’s page is really TradingView’s accuracy ceiling, filtered through however the widget is configured on the backend.
This isn’t unusual. Most consumer finance sites do the same thing rather than paying for a direct exchange data license. The problem is that FintechZoom doesn’t disclose this anywhere on the page, so readers have no way to know whether they’re looking at a primary source or a third-party embed one layer removed from the exchange floor.
From my own experience checking financial aggregator sites against exchange data: widget-based prices typically run 10 to 20 seconds behind true real-time exchange feeds during normal trading hours, and that gap can widen to a minute or more during high-volatility swings, which is exactly when accuracy matters most.
Three Ways to Cross-Check the Number Before You Act

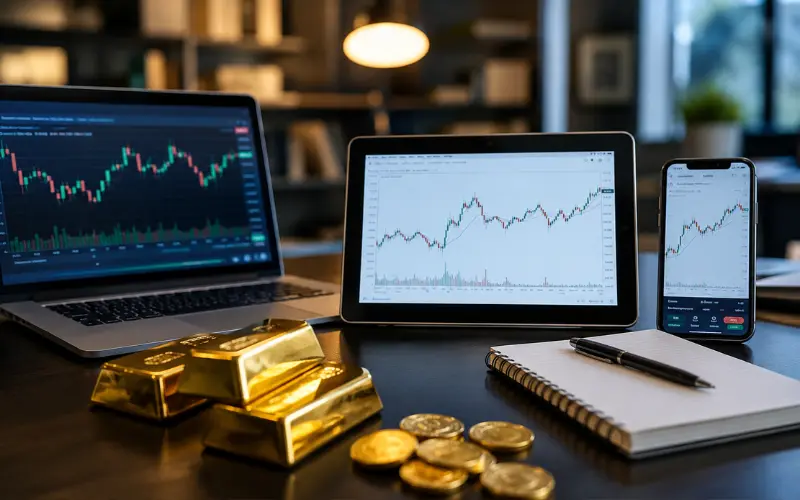
- Compare it to the LBMA Gold Price. The London Bullion Market Association sets a twice-daily benchmark through an electronic auction. It’s the global reference point most institutional pricing traces back to.
- Check a live COMEX futures quote. Sites like the CME Group’s own data pages or a broker’s live ticker show the futures price, which trades close to spot but can diverge slightly based on contract expiry.
- Pull a second aggregator for comparison. Kitco, GoldPrice.org, or your brokerage’s own market data tab. If two independent sources agree within a few dollars, you can trust the range. If they diverge sharply, wait a moment and refresh rather than trading on either number.
Why the Number You See Can Differ From the “Real” Spot Price

Gold doesn’t have one single official price the way a stock has a closing price on a specific exchange. It trades continuously across London, New York, Zurich, and Shanghai, with dealers quoting slightly different bid-ask spreads at any given second. What FintechZoom’s widget shows is a snapshot from one liquidity source at one instant, which is a perfectly reasonable reference point for general awareness but not precise enough for executing a trade at a specific price target.
Currency conversion adds another layer. If you’re viewing the price in a currency other than USD, the site is applying a live forex conversion on top of the base gold quote, and any lag in that forex feed compounds the delay in the gold number itself.
What FintechZoom Gets Right
To be fair, the platform isn’t trying to be a trading terminal. It’s positioned as an entry point for casual investors who want a quick visual on gold trends without opening a brokerage app. For that use case, the TradingView chart is genuinely useful: it shows multi-timeframe views, lets you switch currencies, and sits inside a broader hub that also covers stocks, crypto, and commodities, so you’re not bouncing between five different tabs to get a market overview.
Where this becomes a real problem is when someone treats a casual awareness tool as a trade execution tool. That’s the gap this article exists to close.
When to Use a Different Source Entirely
If you’re placing an actual order, whether that’s buying physical bullion, opening a gold ETF position, or trading futures, go directly to your broker’s live quote or the exchange itself. Use FintechZoom, or any aggregator, for the big-picture trend line: is gold up or down this week, how does today compare to last month, what does the six-month chart look like. Save the precise, second-by-second number for the platform you’re actually transacting on.
| Use Case | Best Source |
|---|---|
| Quick trend check, casual browsing | FintechZoom / TradingView widget |
| Setting a specific buy or sell order | Your broker’s live quote |
| Benchmarking a large transaction | LBMA Gold Price |
| Verifying a suspicious price swing | Two independent aggregators, compared |
Frequently Asked Questions on FintechZoom Gold Price
Is FintechZoom’s gold price accurate?
It reflects TradingView’s underlying data feed, which is generally reliable for trend purposes but can lag true exchange pricing by seconds to over a minute during volatile periods.
Does FintechZoom.com have its own gold price data?
No. The live chart is an embedded TradingView widget rather than a proprietary feed built by FintechZoom itself.
What is the most accurate gold price website?
For institutional-grade accuracy, the LBMA Gold Price benchmark and direct COMEX futures quotes are considered the most authoritative, since they come straight from the exchanges rather than an aggregator layer.
How often does the FintechZoom gold price update?
The TradingView widget refreshes in near real time during market hours, though the surrounding written commentary on the page updates far less frequently.
Will gold hit $10,000 an ounce?
No source can guarantee a specific future price. Some analysts see continued upside given persistent inflation hedging and central bank buying, but $10,000 remains a speculative long-range scenario rather than a near-term forecast.
What is the expected price of gold in 2026?
Forecasts vary by institution and change frequently based on interest rate policy and geopolitical events, so check a current analyst forecast rather than relying on a fixed number from any single article.
Can I trust FintechZoom for daily investment decisions?
Use it for trend awareness, not execution. Cross-check any price you plan to act on against your broker’s live quote or a primary benchmark first.
Why does FintechZoom’s gold price differ from my broker’s app?
Small differences come from feed source, update timing, and currency conversion lag. A gap of a few dollars is normal; a gap of tens of dollars means one of the two sources is stale and worth refreshing before you trust it.